All published articles of this journal are available on ScienceDirect.

Fluorescence Visualization of Upconversion Complexes in Transplanted PC1 Liver Cancer and Rat Organs: Influence of Coating Nanoparticle Complexes
Authors Info & Affiliations
Abstract
Background
Fluorescent imaging of nanoparticles (NPs) in organs and tumors is an important part of diagnosing and treating cancers. Our study investigated the differences in imaging depending on the accumulation of NaYF4 upconversion nanoparticles (UCNPs) in rat organs (heart, lung, liver, spleen, kidneys) and tumor (liver cancer model), based on their shell type, such as human serum albumin (HSA), HSA with folic acid (HSA+FA), or HSA, FA, and the cyanine dye Cy3 (HSA+FA+Cy3).
Methods
We performed simultaneous rapid imaging of NPs using a standard microscope with field-excited luminescence excitation. Histological sections were then prepared according to standard methods, followed by hematoxylin and eosin (H&E) staining.
Results
It was found that NPs accumulated preferentially in tumors. Image processing enabled clear visualization of the accumulation boundaries. These particles may hold promise for future clinical applications, including photodynamic therapy (PDT), due to the observed correlation between particle accumulation and tumor necrosis. When using UCNPs-HSA and UCNPs-HSA+FA, similar changes were detected in rat organs. There were differences in the kidneys depending on the type of particle that was used. When UCNPs-HSA+FA+Cy3 particles were injected into the internal organs, signs of circulatory disorders and minor morphological signs of kidney damage were observed.
Conclusion
The data obtained will enable us to enhance the method of PDT using NPs and a photosensitizer (PS) with additional visualization capabilities.
1. INTRODUCTION
Modern technologies for the detection of malignant neoplasms, based on computed tomography and magnetic resonance imaging, detect a tumor when its volume becomes large enough (contains more than 10 billion cells). In addition, intraoperative assessment of surgical margins is currently subjective, which may lead to incomplete tumour resection and further recurrence [1, 2]. In this context, increasing the sensitivity and resolution of imaging methods to detect masses at early stages of development becomes an urgent task.
The methods include standard light [3-5], fluorescence [6-14], transmission electron [7-17], and scanning electron microscopy [5, 18], and recently developed techniques, including light and electron autoradiography [19-21], fluorescence lifetime imaging [22, 23], spectral imaging and linear unmixing [24], high-resolution structured illumination [25-28], Raman microspectroscopy [29, 30], X-ray microscopy [31], and combination of these technologies [32-34]. Among these methods, fluorescence is a key tool in molecular imaging [8, 35, 36]. A comparison of the methods is presented in Table 1.
One method of tumour imaging involves introducing luminescent drugs into tumours and recording their distribution using fluorescent light (fluorescent imaging). Fluorescence imaging in thick tissues is limited by light penetration depth and resolution due to the scattering and absorption of light in the tissue. This is especially true when using visible light, which is more strongly scattered and absorbed than long-wavelength radiation. Wide-field fluorescence microscopy has limitations, and imaging samples thicker than 30 µm is extremely challenging with wide-field microscopy and virtually impossible if the sample is thicker than 50 µm. The problem with widefield fluorescence microscopy is that the light generated out of focus is captured by the detector, and details are lost. In such cases, the solution is to use optical layering to limit illumination to the in-focus region only. Optical layering can be achieved with confocal microscopes. For imaging thick tissues, methods based on other principles, such as optical coherence tomography or X-ray tomography, can be used.
Compared to dye-based agents, the use of nanoparticles (NPs) for real-time optical imaging of tumours is desirable [37]. Their photostability, size variation, and surface functionalization allow the creation of hybrid systems (agents) with specific properties. The selective accumulation of NPs in tumors appears to be an effective mechanism for labeling and subsequently diagnosing malignant tumor sites. This is primarily due to the abnormal structure of blood vessels [38] and the lack of effective lymphatic drainage in the tumor. The selective accumulation of functional NPs in tumors appears to be an effective marker for the subsequent identification of malignant neoplastic foci.
There are several limitations to the luminescence imaging of NPs in biotissues and organisms. Firstly, there are limitations on spatial resolution due to the diffraction limit. Consequently, the resolution of luminescence imaging cannot exceed 0.2–0.3 µm Table 1. Light scattering within the object leads to further degradation of resolution. Secondly, the depth of penetration of the excitation light into the object is limited. For instance, when using 800- or 980-nm wavelengths to excite upconversion nanoparticles (UCNPs) through human skin, the penetration depth (e-fold attenuation) does not exceed 2.5 mm [39]. Therefore, to obtain luminescent images from greater depths, either the excitation power or the sensitivity of the photodetector must be increased. Alternatively, the time required for the luminescent signal to accumulate on the photodetector must be increased. The most expedient solution is to increase the sensitivity of the photodetector. This allows images to be obtained from greater depths and reduces the time taken for image registration, which may be essential for living objects (as the influence of displacement of the registration area due to breathing or movement of the object is eliminated). The most promising approach is to use electron-multiplying charge-coupled devices (EMCCDs) or intensified charge-coupled devices. When examining small animals, such as mice, the probing depth can be up to 25 mm [37].
An alternative is the Stimulated Emission Depletion (STED) microscopy method, which is currently under development [37, 40, 41]. STED microscopy is a type of laser scanning microscopy that uses additional radiation to deplete the excitation of NPs located at the edge of the excitation region. This method can achieve a resolution of 20-50 nm Table 1. However, this method is only feasible for thin, small samples.
These limitations make it impossible to accurately quantify the concentration of NPs in an object. This uncertainty arises because NPs are distributed in both area and depth. Due to the attenuation of excitation light with depth and the depth-dependent attenuation and scattering of luminescence, the luminescence intensity at neighboring points on an object changes unpredictably, particularly for spatially heterogeneous biological objects. Therefore, while imaging allows for the localization of NPs in an object, quantitative estimates should be treated with caution.
The effectiveness of using NPs in oncological theranostics depends in part on the method of administration and delivery to the treated area. One of the injection methods is intra-arterial. It allows the delivery of agents in high concentrations to the mainstream. It usually takes less than a minute to pass through the entire circulatory system. The highly branched structure of the circulation ensures good mixing of blood solutions within minutes, except for substances with a high first-pass metabolism. In this case, a larger amount of the drug will accumulate in the tumor, while a smaller amount will accumulate in the mononuclear phagocyte system. However, this route of injection is usually associated with a high risk. After intravenous injection, in vivo agents always interact with blood components, leading to the accumulation of a large amount in the mononuclear phagocyte system (liver and spleen) [42].
| Metod | Probing Depth | Resolution | Remark | Reference |
|---|---|---|---|---|
| Standard Light Microscopy | ~200 µm | ~200–250 nm | Simple, used for live cells | [3-5] |
| Fluorescence Microscopy | ~100–200 µm | ~200–300 nm (up to 20–50 nm) | High specificity | [6-14] |
| Transmission Electron Microscopy | ~100 nm | ~0.1–0.2 nm | High resolution, complex sample preparation | [7-17] |
| Scanning Electron Microscopy | ~1–10 µm | ~1–10 nm | Surface visualization | [5, 18] |
| Light Autoradiography | ~100–200 µm | ~1–10 μm | Used for radioactive labels | [19-21] |
| Electron Autoradiography | ~50–100 nm | ~10–50 nm | High precision, complex sample preparation | [19-21] |
| Fluorescence Lifetime Imaging Microscopy | ~100–200 µm | ~200–300 nm (up to 50 nm) | Molecular interactions | [22, 23] |
| Spectral Imaging | ~100–200 µm | ~200–300 nm | Multichannel visualization | [24] |
| High-Resolution Structured Illumination Microscopy | ~100–150 µm | ~100–120 nm | Super resolution | [25-28] |
| Raman Microspectroscopy | ~10–100 µm | ~300–500 nm | Chemical analysis | [29, 30] |
| X-Ray Microscopy | ~1–10 mm | ~10–50 nm | Deep penetration | [31] |
UCNPs occupy a special place among luminescent NPs. Upconversion (UC) is a nonlinear optical process that transforms long-wavelength excitation radiation into short-wavelength radiation by summing electronic excitation energy [43, 44]. It involves the conversion of a few low-energy excitation photons, usually near-infrared light, into shorter-wavelength radiation (e.g., visible and ultraviolet). It is worth noting that the near-infrared (NIR) excitation of the UC luminescence ensures the absence of autofluorescence in biological tissue, which increases the signal-to-noise ratio and sensitivity of luminescence measurements. IR radiation, which excites the UCNPs, penetrates deeper into the tissue because it corresponds to the “transparent region” of the biotissue. In this case, the particles emit luminescence in the visible range, i.e., the particles can serve as local sources of excitation for the photosensitizer (PS). By choosing a combination of UCNP and PS based on the overlap of their spectra, it is possible to obtain the same efficiency of oxygen excitation, i.e., the same therapeutic efficiency, but with a lower radiation dose and at a greater depth.
The small size of UCNPs enables the particles to pass through biological barriers, allowing for deep penetration into tissues and the accumulation of particles in organs. UCNPs doped with rare earth ions are composed of three components: the host matrix, the sensitizer ions, and the activator [45]. The host matrix is one of the most important components of UCNPs, as it provides essential and unique UC optical properties, including UC efficiency and emission spectra. The sensitizer can be effectively excited by light energy. A number of quanta of its energy can be transferred to an activator one after the other or at the same time, where a fluorescent quantum can be emitted. Therefore, the activator is the luminescence center in UCNPs, and the sensitizer enhances the UC luminescence efficiency. The dopants, sensitizer, and activator are added to the host lattice in relatively low concentrations (usually ∼20 mol% for the sensitizer and <2 mol% for the activator). The trivalent ion Yb3+, which has an extremely simple energy level scheme, is often used as a UC sensitizer. Er3+, Tm3+, and Ho3+ ions have ladder-like energy levels with equal distances between levels and are therefore most often used as UC activators [46]. Among the available types of UC host materials, fluorides have proven to be ideal host candidates for UC because of their very low phonon energies and high chemical stability. In particular, Yb3+/Er3+ and Yb3+/Tm3+ doped NaYF4 have been previously reported as the most efficient UC materials to produce green and blue emissions [47, 48]. It was found that SrF2:Yb3+, Er3+ water colloid, additionally doped with transition metals (Sc3+ or Zn2+), was tested to enhance the observed emission during 22 weeks of storage under ambient conditions. The obtained compounds presented high stability throughout the entire duration of the experiment, with minor changes in their composition, emission intensity, and thermal sensitivity [49]. Recently, a new type of I-organic-PS-functionalized UCNPs, combining Se6 and UCNPs, has been proposed for enhanced PDT [50].
Functionalization of NPs with photodynamic dye requires additional coating of their surface with shells. In addition, the surface coating must be considered in terms of its protective role in the dissolution of NPs and its potential toxicity [51]. UCNPs have been demonstrated to exhibit both good biocompatibility and low toxicity in in vivo and in vitro toxicity studies [22-54].
Serum albumin nanoshells are biocompatible with many cell types over a wide range of concentrations [55], are easily internalized by cells [55, 56], are non-immunogenic, and have a long half-life in the circulation [57, 58]. Many photodynamic dyes, such as methylene blue and the sodium salt of fluorescein, spontaneously bind to albumin, making it quite easy to cover the surface of NPs with a dye. It was found that coating NPs with an albumin shell enhances biocompatibility, enabling the use of these particles for cell visualization [59-61]. There are few studies on the use of NPs with an albumin shell for PDT, despite the obvious advantages in terms of toxicity [62-65]. Different particles, including methylene blue [62], NaGdF4 [63], and perfluorotributylamine [64], were used, which were pre-modified with chlorine e6, a clinically used polymer, together with catalase. These particles were mixed with an effective antitumor drug, paclitaxel [65].
Targeting agents can also be attached to the surface of NPs to selectively target specific cells. In particular, FA can be used as a targeting agent [66-68], resulting in a drug delivery system that is specific to cancerous tissue. Functionalizing NPs in this way can enhance the efficacy of therapy [69].
The most common method for fluorescence visualization of UCNPs in tissues and organs is the use of a scanning system. In this case, the excitation radiation is focused on the surface of the object, and the luminescence is collected by a wide-aperture optical system, which is then recorded by a photodetector. Scanning is performed point-by-point by moving the illuminated area over the object [70]. One modification of such a system is a laser scanning confocal microscope [71, 72].
Xiong et al. proposed the use of a small-animal UC luminescence imaging system for Yb3+-sensitized UCNPs. Two external CW fibre lasers at 980 nm with adjustable power were used as excitation sources [73]. In this system, beam expanders converted the radiation into larger diameter beams, which then homogeneously illuminated the entire body of the small animal. An EMCCD was used to collect weak UC emission. In this case, the entire image was captured simultaneously with a short signal accumulation time.
To date, some commercial UC luminescence in vivo imaging systems are available with similar modifications. Taking advantage of the working light in the NIR range, this UC luminescence imaging system for small animals also performed well in the presence of ambient illumination light [74]. This is extremely important for potential applications, such as image-guided surgery, where doctors require proper illumination during the surgical procedure while the UC imaging system is in operation.
In addition to observing the spatial distribution of NPs in objects, it is also necessary to study the response of tissues and organs throughout the body to the introduction of NPs [75]. Currently, there are few publications that correlate the visualization of NPs in an organ with the change in organ state due to exposure to these NPs. Notably, a review compiling 237 publications did not include any papers addressing this topic [37].
Consequently, it is impossible to determine whether changes in organs are caused by the direct influence of NPs or by the organism's general reaction to them.
This study aimed to determine the correlation between NP accumulation in rat organs after injection and the corresponding histological data. We utilized a fluorescence microscope to determine the localization of UCNPs with different shell compositions in tumors and organs. At the same time, a histological study of changes in the organs and tumors was also performed.
2. METHODOLOGY
This study was conducted using 20 laboratory animals housed in cages. Male laboratory rats with an average age of 2 months and a weight of 250 g were used. The animals were fasted overnight (for about 18 hours) on the last day of the experimental protocol before the induction of anesthesia or the collection of blood samples. General anesthesia was used in all experiments. Xilanit (Nita-Pharm, Russia), which has muscle relaxant and anesthetic effects, and Zoletil 100 (Virbac, France), a lyophilized powder for injection with a dissociative and pronounced analgesic effect, were used to anesthetize the animals. Zoletil powder was diluted with saline at a concentration of 10 mg/ml. Before anesthesia, each animal was weighed, and the required dosage was calculated based on its weight. The drugs were then administered intraperitoneally: Xilanit (0.1 ml per animal) and Zoletil 100 (0.1 ml per 100 g of body weight). The injection site was pre-treated with alcohol. Animals with liver tumors were intravenously injected with the nanoparticle (NP) suspension. After a predetermined time, tumor and organ samples were collected, and slices were examined using a fluorescence microscope. Histological studies were also performed on the slices.
2.1. UCNPs Synthesis and Characterization
UCNPs [NaYF4:Yb3+, Er3+] (fluoride matrix doped with ytterbium and erbium ions) were synthesized by a hydrothermal method as described previously [76].
Briefly, the methodology used to synthesize was as follows:
To a mixture of Y(NO3)3 (3 mL), Yb(NO3)3 (0.6 mL) and Er(NO3)3 (0.04 mL) solutions at a concentration of 1M, solutions of sodium citrate (Na3C6H5O7, 1M, 4 mL) and citric acid (C6H8O7, 3.66M, 50 mL) were added successively. Then, 38 mL of 2M ammonium fluoride (NaF) solution was added, and the resulting gel-like solution was stirred for 30 minutes. The Y/Yb/Er ratio was 1/0.2/0.013.
The solution was poured into a 100 ml reactor and heated at 180 °C for 18 hours. The synthesized NPs were washed three times with distilled water, with intermediate precipitation achieved by centrifugation (6000 rpm, 15 min), and then air-dried. For partial replacement of citrate ions with BF-4, the NPs were mixed with aqueous NaBF4 solution in the ratio of 60 mg NaBF4 to 25 mg NPs. The mixture was stirred for 20 hours using a PTR-25 mini-rotator.
The NPs were then washed three times with ethanol and dried. UCNP images (Fig. 1), obtained using the field-emission scanning electron microscope (SEM) MIRA 2 LMU (TESCAN, Czech), were used for particle morphology and size assessment. The average size of UCNPs was measured using ImageJ software.
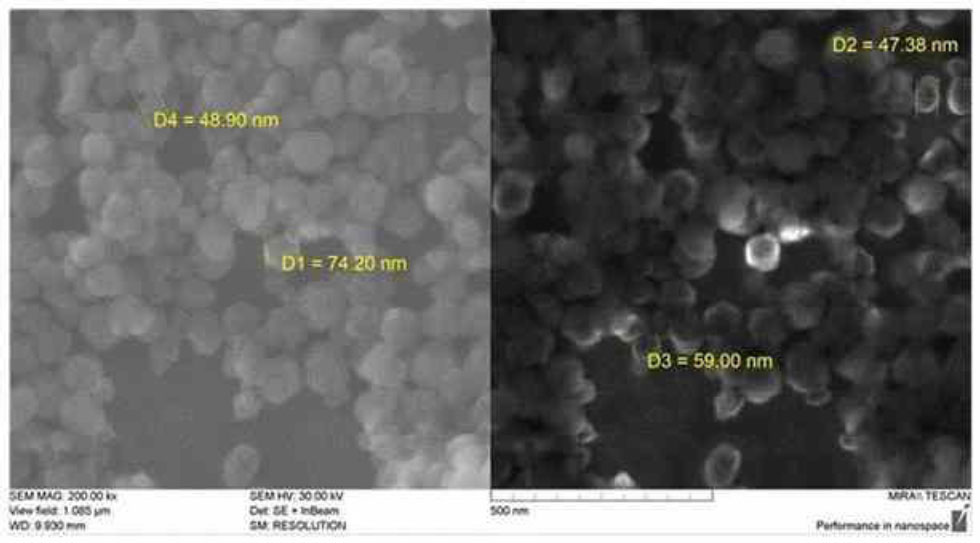
SEM (MIRA 2 LMU, TESCAN) image of the [NaYF4: Er3+, Yb3+] UCNPs.
To coat the NPs with dye-conjugated albumin shell, 40 mg of dry NPs were added to 10 ml of a solution of commercial HSA preparation (Sigma-Aldrich, USA) at a concentration of 2 mg/mL in 0.05 M phosphate buffer at pH 6.5. The suspension was incubated for 0.5 hours with vigorous stirring using a magnetic stirrer. Then, 30 μL of 3% hydrogen peroxide solution was added and stirred for another 0.5 hours. The NPs were precipitated by centrifugation (6000 rpm, 10 minutes). The precipitate was resuspended in the washing buffer and precipitated again. The procedure was repeated three times, and then the NPs were suspended in 10 ml of buffer solution.
The attachment of FA to the albumin coating of NPs was carried out by standard EDC/NHS covalent binding. For this purpose, 40 mg of FA (C19H19N7O6), 14 mg of 1-ethyl-3-(3-dimethylaminopropyl)carbodiimide, and 10.4 mg of N-hydroxysuccinimide were dissolved in 2.8 mL of dimethylsulfoxide. The solution was stirred for 30 minutes and then added dropwise to the solution containing NPs while stirring vigorously. After addition, the mixture was stirred for 3 hours at room temperature. The NPs were precipitated by centrifugation, washed three times with saline solution, and then suspended in saline solution at a concentration of 4 mg/ml. The resulting solution was stored in the dark at 4-60°C. The NP suspension acquired a yellow color characteristic of FA. The presence of FA on the surface was visualized by IR spectroscopy.
2.2. Agents
UCNPs coated with shells of HSA, HSA with FA, HSA, FA, and cyanine 3B NHS-ether (Cy3) (LumiprobRus LLC, Moscow, Russia) were used. The UCNP concentration was 2 mg/mL. The volume of a single administration to the rat was 0.9-1.116 ml. A physiological solution was used as the medium for intravenous injections.
2.3. Tissue Samples
Experiments with laboratory animals were conducted at the Centre for Collective Use of Saratov State Medical University (SSMU, Russia). All animals underwent the required quarantine in a vivarium, where they were kept in a closed, heated room at a temperature of 20-25°C in individual cages. The food regime was standard, using compound feed for rodents. The duration of observation for laboratory animals was up to four weeks (reaching a humane endpoint).
All the work with laboratory animals was carried out in accordance with the research protocol that does not contradict the 1985 Geneva Convention on the “International Principles of Biomedical Research Involving Animals” and the 2000 Helsinki Declaration on the Humane Treatment of Animals.
Healthy white laboratory rats underwent subcutaneous implantation in the scapular region with 0.5 ml of 25% tumor suspension in Hank's solution, using the PS-1 strain of alveolar liver cancer. The experiment began when the tumors reached a volume of approximately 1 cm3. The rats were divided into four groups, each consisting of five animals. The number of animals per group was determined to ensure a statistically reliable result with the minimum sample size. Selection criteria for the animals included gender, age, weight, and tumor size. Stratified randomization was used to allocate animals to comparison and treatment groups. Data from all animals were included in the analysis. Minimization of potential confounding factors, such as the order of treatment or measurements and cage location, was not required, as these factors did not influence the outcomes. Investigators were aware of group assignments during allocation, experiment performance, result assessment, and data analysis. However, pathologists were blinded to group assignments at all stages to independently assess the histological material.
The comparison group was not injected with any type of particles. The experimental groups are: Group 1 was injected with UCNPs-HSA, Group 2 with UCNPs-HSA+FA, and Group 3 with UCNPs-HSA+FA+Cy3, all intravenously. Organ and tumour samples were taken the following day after intravenous administration of the particle suspension.
The test specimens were 5 µm-thick sections obtained from paraffin blocks of rat organs (heart, lung, liver, spleen, and kidneys) and tumors, which were originally prepared for histological analysis. Sections were cut using an Accu-Cut SRM microtome (Sakura, Japan), then flattened in a water bath, mounted on slides, and dewaxed with Bio-Clear (Bio-Optica, Italy) for 30 minutes at 22 °C. Preparation of slices for fluorescence microscopy followed the same protocol as histological slices, except that hematoxylin and eosin (H&E) staining was omitted.
This study adhered to internationally accepted standards for animal research, following the 10 Rs principle. The ARRIVE guidelines were employed for reporting experiments involving live animals, promoting ethical research practices. The topic and descriptions of the experiments were approved by the Ethics Committee of the SSMU (protocol No. 13, dated 06/05/2025).
2.4. Experimental Setup and Methods
An AxioScope A1 microscope (Zeiss, Germany) with a 4x0.1 objective (Olympus, Japan) was used to record the luminescence image generated by NP radiation (Fig. 2). Registration was carried out using a high-speed, supersensitive EMCCD camera, iXonUltra 897 (Andor Technology, UK). The radiation of an LSR980NL-1000 laser (Lasever, China) with an output wavelength of 980 nm and an output power of 1 W excited the luminescence. The radiation was collimated, and the diameter of the irradiated region on the sample surface was 6 mm. Thus, the power density of the exciting radiation was 3.5 W/cm2. The irradiated areas of the sample were chosen arbitrarily. Fluorescence emission from NPs was extracted using a 546.5-22 bandpass filter (Alluxa, USA). The bandpass filter, with a central wavelength of 546.5 nm, exhibited 98% transmission within a 22 nm band, resulting in the complete suppression of the remaining radiation. Ten identical images were taken for the same observation area, with each image having an exposure time of 10 ms.
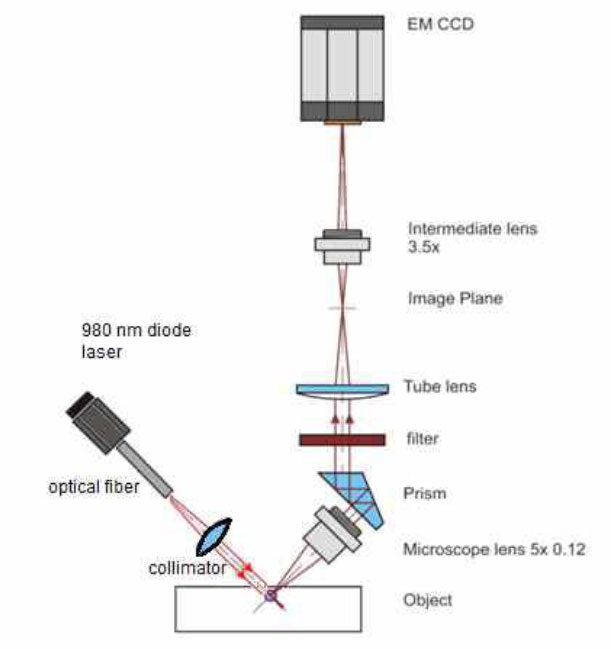
Experimental setup. The filter installed in the microscope removes scattered light at 980 nm and transmits light in the range of 320–360 nm.
Images were processed using the program Fiji ImageJ [77]. Ten images were averaged to reduce noise. The average brightness of the image was calculated as a measure of the number of NPs in the irradiated area. This value was equal to the ratio of the total brightness to the area of the image. As a result, this value was independent of the spatial arrangement of the luminescent NPs, depending only on their quantity. The lack of reference samples prevented the determination of absolute NP concentrations in the samples; however, comparative studies were still possible.
The luminescence spectra of NPs were measured using a Cary Eclipse integrating sphere spectrofluorimeter (Agilent, USA). A 975 nm laser (Avantes, Russia) was used to excite the luminescence of particles.
The remaining tumor tissue from all groups was fixed in a 10% formalin solution and embedded in paraffin. Histological sections were then prepared according to standard methods, followed by H&E staining. The morphological study was performed independently by two experts in the field of pathological anatomy. Thus, the study was double-blind.
Morphometry and photomicrography were performed on at least ten fields of view of each specimen using a µVizo-103 Medical Transmittance Microscope (LOMO, Russia).
For statistical processing (IBM SPSS 26, USA) of the percentage of necrosis area in the visual field, the nonparametric Mann-Whitney test was used to establish significant differences between groups (with median, minimum, maximum, and quartiles calculated).
Statistical data analysis was performed using 'Statistics 6.0,' specifically Spearman's rank correlation coefficient, a quantitative measure of statistical relationships between phenomena used in nonparametric methods. Nonparametric methods enable the analysis of data from small samples, particularly when the distribution of variables is unknown. Spearman’s correlation coefficient is a statistical measure of the strength of a monotonic relationship between paired data. In a sample, it is denoted by rs and is, by design, constrained as follows: -1 ≤ rs ≤ 1. The closer the relationship is to -1 or 1, the stronger the monotonic relationship. Correlation is an effect size, and we can describe the strength of the correlation using the following guide for its absolute value:
- 0.00-0.19 “very weak”;
- 0.20-0.39 “weak”;
- 0.40-0.59 “moderate”;
- 0.60-0.79 “strong”;
- 0.80-1.0 “very strong”.
3. RESULTS
The normalized luminescence spectra for the initial and synthesized NPs are shown in Fig. (3).
It was found that UCNPs accumulated predominantly in the tumour, which was confirmed by histopathological analysis (Fig. 4).
As shown in Table 2, the statistical analysis of the tumor necrosis area under the influence of different particle types and the associated morphological changes in organs was carried out. The most pronounced morphological changes in the tumor were observed following the injection of UCNPs–HSA and UCNPs–HSA+FA+Cy3 particles, with medians of 70% and 60%, respectively, which were significantly higher than those observed in the control group (Table 2). In contrast, the injection of UCNPs–HSA+FA particles did not produce significant differences compared to the control group.
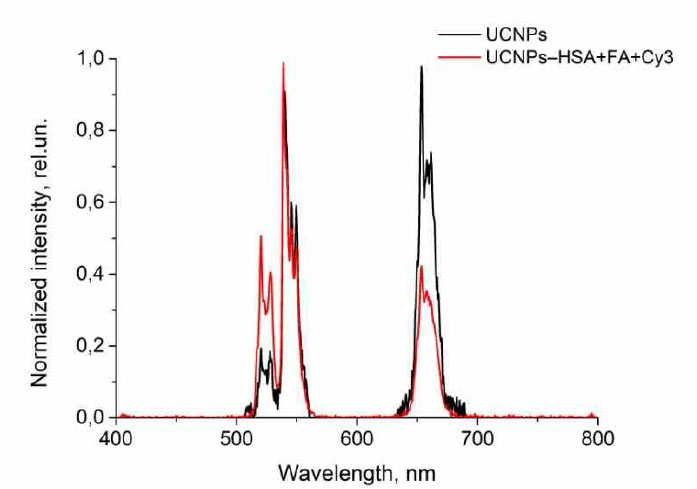
Luminescence spectra of the UCNPs and UCNPs–HSA+FA+Cy3.
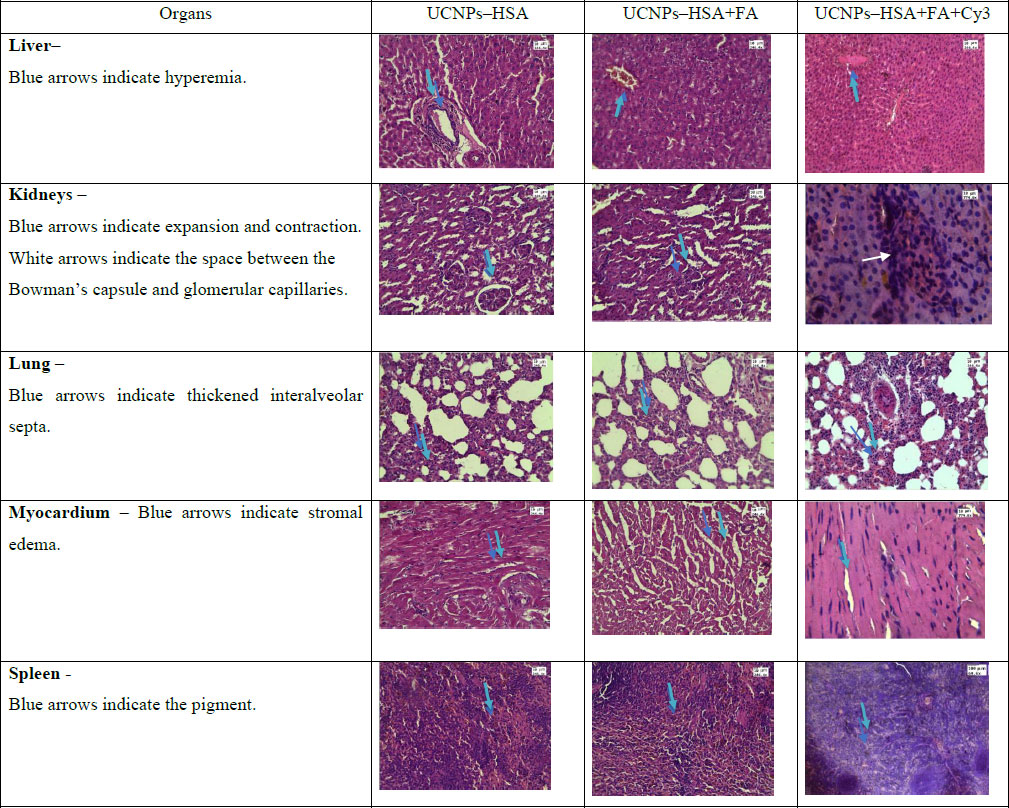
H&E-stained sections of different organs following intravenous injection of UCNPs–HSA, UCNPs–HSA+FA, or UCNPs–HSA+FA+Cy3, observed under a light microscope. Arrows indicate changes in the organs.
| No Group | Group Name |
The Area of Necrosis in the Field of View Median (Min-Max) |
Characteristic Changes in Organs |
|---|---|---|---|
| 1 | ComparisonGroup | 17.5% (10-50%) |
There are no significant changes. |
| 2 | UCNPs–HSA | 70% (10-83%) |
Increasing the space between the Bowman's capsule and vascular glomeruli. |
| 3 | UCNPs–HSA+FA | 17,5% (10-35%) |
There was a decrease in the space between the Bowman's capsule and the vascular glomeruli. |
| 4 | UCNPs–HSA+FA+Cy3 | 60% (20-80%) |
Enlargement of the space between the sinusoids of the liver and swelling of epithelial cells in the convoluted tubules. |
It should be emphasized that all changes in the organs were reversible, whereas the changes in the tumor were irreversible, manifesting as necrosis (cell death). Thus, the morphological changes in the tumor were more pronounced than the toxic effects observed in the organs. The data showed significant changes in both the organs and tumor following the injection of different types of nanoparticles Table 3.
We conducted studies on the visualization of nanoparticles (NPs) in rat organs and tumor tissue sections. This was achieved by directly capturing luminescence images. The resulting images are shown in Figs. (5-7) (A-C). NPs embedded in biological tissue appeared as light spots, with the spot size determined by the diffraction pattern created by the optical system. The figures show a significant number of NPs, both individual and aggregated.
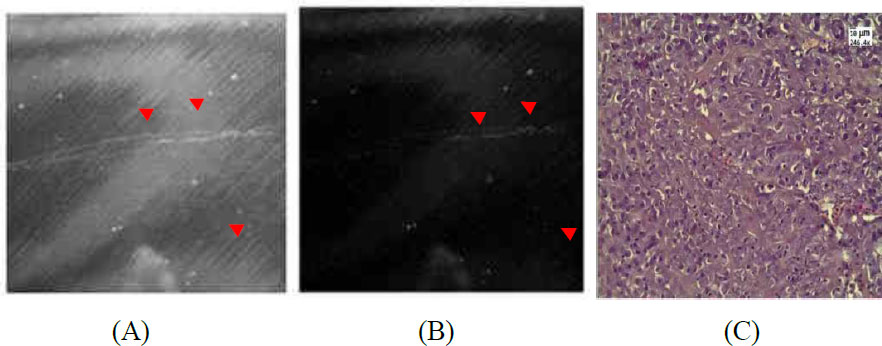
(A) Example of tumor sample after intravenous UCNPs–HSA injection. (B) Image after processing. Red arrows indicate particles. (C) H&E-stained sections of the tumor obtained under a light microscope (80% necrosis). Blue arrow indicates necrosis, where the nuclei in the cells are either absent or highly fragmented.
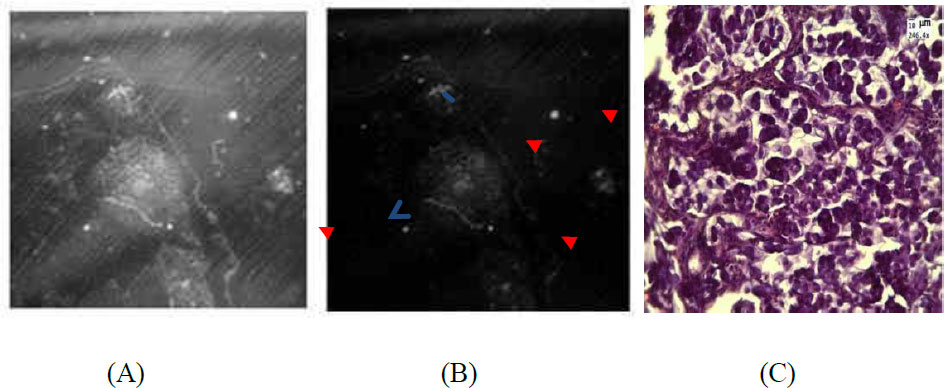
(A) Example of tumor sample after intravenous UCNPs–HSA+FA injection. Arrows indicate particles. (B) Image after processing. Red arrows indicate particles. (C) H&E-stained sections of the tumor obtained under a light microscope (10% necrosis). Blue arrow indicates necrosis.
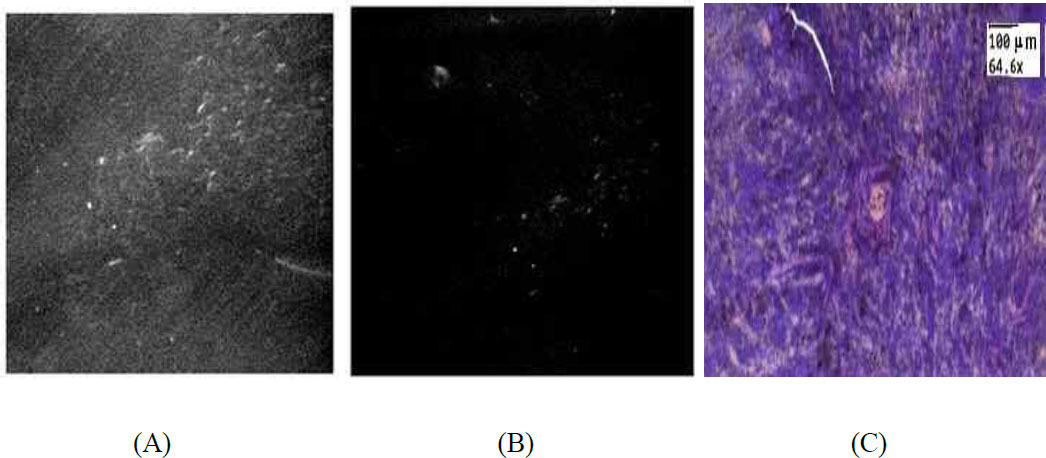
(A) Example of spleen sample after intravenous UCNPs–HSA+FA+Cy3 injection. (B) Image after processing. Arrows indicate particles. (C) H&E-stained sections of spleen tissue, interspersed with particles indicated by the arrow.
| 1 | 2 | 3 | 4 | |
|---|---|---|---|---|
| 1 | 1.00 | 0.005 | ||
| 2 | 0.072 | 0.072 | ||
| 3 | 1.00 | 0.072 | 0.005 | |
| 4 | 0.005 | 0.072 | 0.005 |
4. DISCUSSION
It should be noted that studying the toxicity of nanoparticles (NPs) against the background of tumor growth is not ideal. However, we collected organ samples and assessed the changes in the groups, although it is difficult to determine whether these changes were due to the particles themselves or to the intoxication caused by the necrotic tumor. Morphological changes in the internal organs were similar across all groups in the context of tumor growth, though with varying degrees of severity. Moderate liver hyperemia, sinusoid dilation, thickening of the interalveolar septa in the lungs, vascular stasis, mild edema of the myocardial stroma, and a predominance of white pulp over red pulp in the spleen were observed in the UCNP-HSA and UCNP-HSA+FA groups. Differences related to the type of particle shell used were observed in the kidneys. With UCNP-HSA, there was an increase in the space between the Bowman’s capsule and glomerular capillaries, while UCNP-HSA+FA led to a decrease in this space. When UCNP-HSA+FA+Cy3 particles were injected, changes in the internal organs included an increase in the space between sinusoids, stagnation of blood vessels, edema of the myocardium, moderate thickening of the internal alveolar septa, swelling of epithelial cells in the convoluted tubules, blurred boundaries between red and white pulp, and pigment deposition in the red pulp. In the control group, morphological changes in the organs were less pronounced, which may be due to less necrosis of the tumor tissue.
In groups of animals that were injected intravenously with UCNP-HSA+FA+Cy3 complexes, the concentration of NPs observed was lower than that in the liver or spleen. The addition of FA to UCNPs-HSA did not affect the accumulation of particles in the tumor. This is likely due to the presence of FA in the shell, which significantly reduced the circulation time of NPs in the blood. It was found that red blood cells effectively absorbed NPs coated with HSA. This is evidenced by the observation of a precipitate of UCNPs in the tube, visible through the luminescence of the NPs, after the red blood cells were washed and hemolyzed.
In the tumor groups of animals treated intravenously with UCNPs-HSA+FA+Cy3 complexes, the observed concentration of NPs in the tumor was lower than in the liver or spleen. This can possibly be explained by the reduced aggregation compared to other types.
The correlation coefficient between the mean brightness of particles' luminescence in tumor sections Table 4 and the degree of necrosis was 0.55 (Spearman correlation), indicating a moderate correlation strength, probably related to the absence of UCNPs-HSA+FA+Cy3 particles in the tumor.
| Type of Exposure (organ) | Average Image Brightness Values |
|---|---|
| UCNPs–HSA+FA+Cy3, spleen | 1.82 |
| UCNPs–HSA, tumor | 4.11 |
| UCNPs–HSA+FA, tumor | 1.83 |
| UCNPs–HSA, drop of blood | 6.84 |
| UCNPs–HSA, blood smear | 0.47 |
The synthesized nanocomplexes were biocompatible. Complexes with albumin demonstrated better tolerance and longer circulation time in the bloodstream compared to literature data for similar nanoparticles (NPs) with other coatings. The primary advantage of the synthesized nanocomplexes is that they are not commercially available preparations for photodynamic therapy (PDT) that require further development and testing.
In terms of theranostics, UCNPs–HSA+FA+Cy3 complexes can be used for visualization in combination with PDT, while UCNP-HSA and UCNP-HSA+FA particles can be used in combination with laser treatment for tumor tissue.
It may also be worth exploring the integration of the methods proposed in this study with deep learning, which could significantly accelerate the image processing process.
CONCLUSION
The visualization of UCNPs complexes in biological samples was demonstrated through image registration using a CCD camera, eliminating the need for point-to-point image scanning. Light spots represent nanoparticles (NPs) embedded in biological tissue, with their size determined by the diffraction pattern generated by the optical system. A significant number of NPs, both individual and aggregated, were detected, with UCNPs primarily accumulating in the tumor.
Pronounced tumor necrosis was observed in up to 80%, 10%, and 20% of the sectioned area for UCNPs-HSA, UCNPs-HSA+FA, and UCNPs-HSA+FA+Cy3, respectively. Morphological changes in the internal organs were similar across all groups in the context of tumor growth, though with varying degrees of severity.
The data obtained will contribute to the improvement of photodynamic therapy (PDT) methods using NPs and a photosensitizer (PS) in conjunction with additional visualization techniques.
AUTHORS’ CONTRIBUTIONS
The authors confirm their contribution to the paper as follows: V.K.: Writing the original draft; I.F., N.N. and A.M.: InvestigationWriting the paper. All authors reviewed the results and approved the final version of the manuscript.
LIST OF ABBREVIATIONS
| CCD | = Charge-Coupled Device |
| CW | = Continuous Wave |
| Cy3 | = Cyanine 3B NHS-ether |
| EDC | = 1-Ethyl-3-(3-dimethylaminopropyl)carbodiimide |
| EMCCD | = Electron-multiplying charge-coupled device |
| FA | = Folic Acid |
| H&E | = Hematoxylin and Eosin |
| HSA | = Human Serum Albumin |
| IR | = Infrared |
| NIR | = Near Infrared |
| NHS | = N-hydroxysuccinimide |
| NPs | = Nanoparticles |
| PDT | = Photodynamic Therapy |
| PS | = Photosensitizer |
| STED | = Stimulated Emission Depletion |
| UC | = Upconversion |
| UCNPs | = Upconversion Nanoparticles |
| UCNPs-HSA | = Upconversion Nanoparticles with Human Serum Albumin |
| UCNPs-HSA+FA | = Upconversion Nanoparticles with Human Serum Albumin and Folic Acid |
| UCNPs-HSA+FA+Cy3 | = Upconversion Nanoparticles with Human Serum Albumin, Folic Acid, and Cyanine 3 dye |
ETHICS APPROVAL AND CONSENT TO PARTICIPATE
All the experiments were approved by the Ethics Committee of the SSMU (protocol No. 13, dated 06/05/2025).
HUMAN AND ANIMAL RIGHTS
This study adhered to internationally accepted standards for animal research, following the 3Rs principle. The ARRIVE guidelines were employed for reporting experiments involving live animals, promoting ethical research practices. All animal experiments were performed in accordance with the Care and Use of Laboratory Animals guidelines.
AVAILABILITY OF DATA AND MATERIALS
The authors confirm that the data supporting the findings of this research are available within the article.
FUNDING
The study was supported by a grant from the Russian Science Foundation (No. 25-22-00144), https://rscf.ru/project/25-22-00144/.
ACKNOWLEDGEMENTS
Declared none.